
jmeter Grafana 监控

jmeter Grafana 监控
Pupper一、数据收集 (Exporter)
exporter是 prometheus 一类数据采集组件的总称, 他负责从目标处收集数据, 并转换为 prometheus 支持的格式node_exporter是一种比较主流的服务器性能指标采集工具, 默认端口为 9100mysql_exporter用于收集 MySQL 数据库的各项指标, 默认端口为 9104
1. 下载 Exporter
nohup 静默启动, 2>&1 不显示 nohup 时的报错信息, & 允许后台运行
1 | cd /usr/local/node_exporter |
二、保存数据 (Prometheus 普罗米修斯)
Prometheus: 是一款开源的监控报警系统与时序数据库, 默认端口为 9090
对时间精度要求较高, 如果服务器时间与现实时间不同步, 可能无法收集到准确的数据.
时间校准命令:
1 | ntpdate ntp.aliyun.com |
如果提示没有 没有 ntpdate 命令, 则使用以下命令进行安装
1 | yum install -y ntp |
与 Exporter 或 sql 关联, 在 /usr/local/prometheus/prometheus.yml 中修改
1 | # node_exporter 关联 |
localhost 可以修改为实际需要关联的服务器
三、展示数据 (Grafana)
Grafana是一个开源的, 可视化监控工具;
可以配合Prometheus与node_exporter配合监控服务器
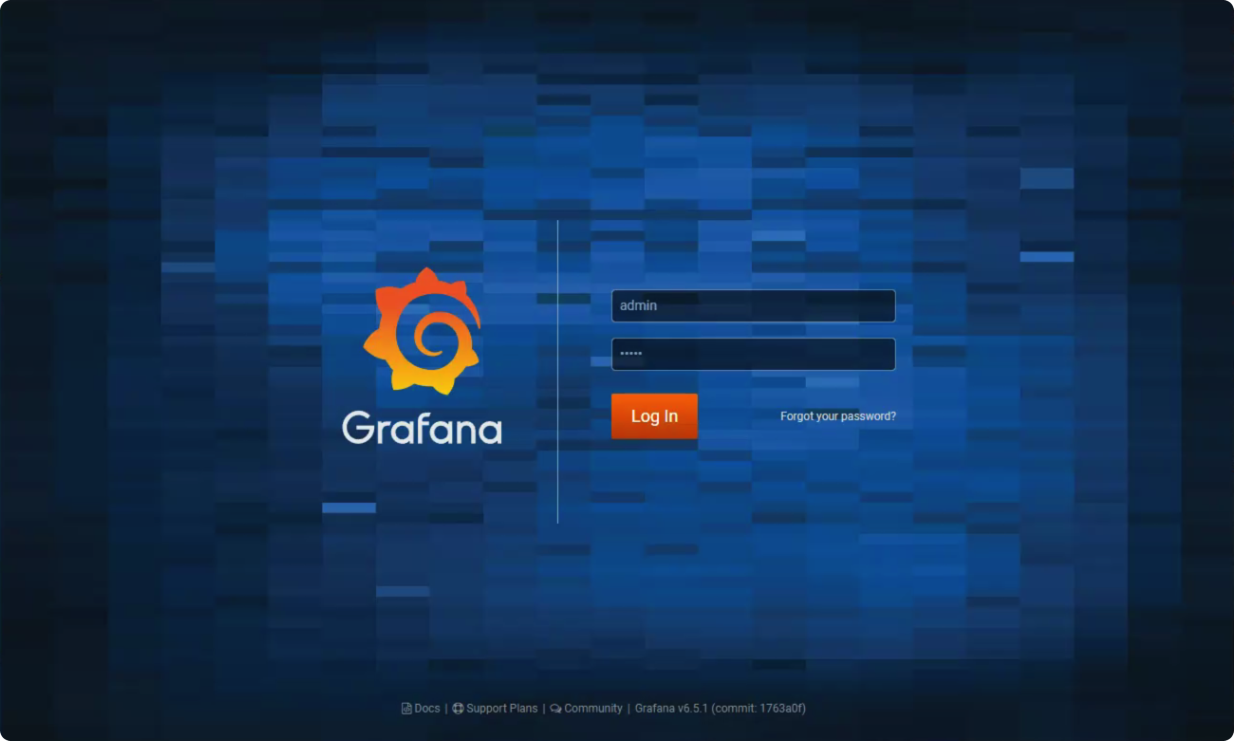
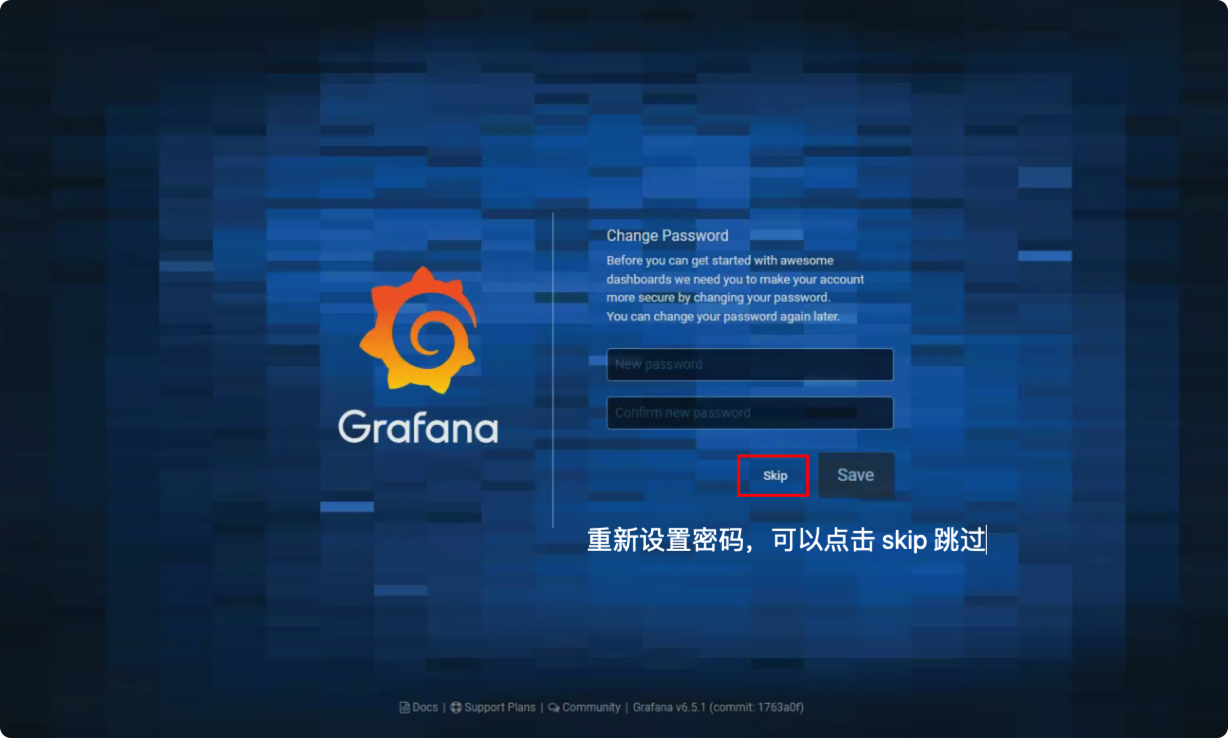
1.登录 Grafana , 默认账号密码为 admin
2.关联 Prometheus
URL 尽量写全路径, 防止关联失败
3. 添加监控模板


喜欢这篇文章的人也看了


评论
匿名评论隐私政策
✅ 你无需删除空行,直接评论以获取最佳展示效果